”_—С‹Ж
Agriculture
&Forestry
”_—С‹Ж
| “ЊЏШ‹ЖЋн•КЉ”‰їЋwђ”(‘ж€к•”ЃAЊЋ––) | |||||||||||||||
| Stock Price Index by Industry Sector (1st Section, End ofЃ@Month) | |||||||||||||||
| Ѓ@ | GM1 | ||||||||||||||
| “ъ•t | ђ…ЋYЃE ”_—С‹Ж |
||||||||||||||
| date | Fishery, Agriculture &Forestry |
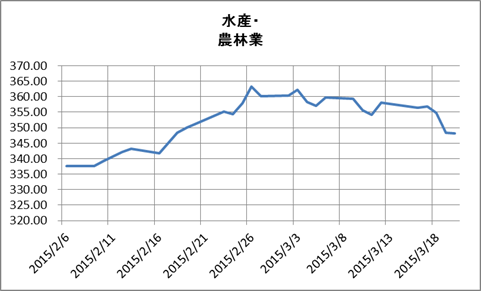
Latest 30days | Latest 30days | ||||||||||||
| 2013/8/1 | 270.89 | “ъ•t | ђ…ЋYЃE ”_—С‹Ж |
|
|||||||||||
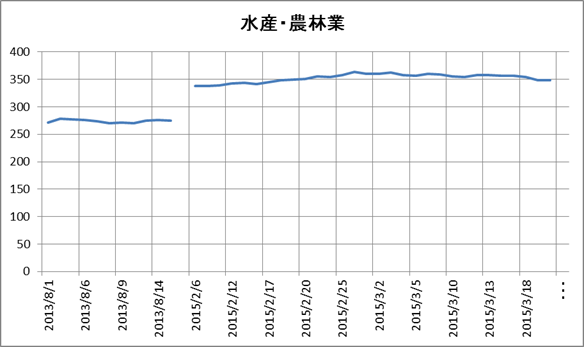
| 2013/8/2 | 277.85 | 2015/2/6 | 337.60 | ||||||||||||
| 2013/8/5 | 277.56 | 2015/2/9 | 337.69 | ||||||||||||
| 2013/8/6 | 276.5 | 2015/2/10 | 339.19 | ||||||||||||
| 2013/8/7 | 273.97 | 2015/2/12 | 342.08 | ||||||||||||
| 2013/8/8 | 270.3 | 2015/2/13 | 343.17 | ||||||||||||
| 2013/8/9 | 271.85 | 2015/2/16 | 341.73 | ||||||||||||
| 2013/8/12 | 270.36 | 2015/2/17 | 345.15 | ||||||||||||
| 2013/8/13 | 274.54 | 2015/2/18 | 348.47 | ||||||||||||
| 2013/8/14 | 276.26 | 2015/2/19 | 350.03 | ||||||||||||
| 2013/8/15 | 274.64 | 2015/2/20 | 351.17 | ||||||||||||
| 2013/8/16 | Ѓ@ | 2015/2/23 | 355.10 | ||||||||||||
| 2015/2/6 | 337.6 | 2015/2/24 | 354.42 | ||||||||||||
| 2015/2/9 | 337.69 | 2015/2/25 | 357.80 | ||||||||||||
| 2015/2/10 | 339.19 | 2015/2/26 | 363.26 | ||||||||||||
| 2015/2/12 | 342.08 | 2015/2/27 | 360.15 | ||||||||||||
| 2015/2/13 | 343.17 | 2015/3/2 | 360.29 | ||||||||||||
| 2015/2/16 | 341.73 | 2015/3/3 | 362.19 | ||||||||||||
| 2015/2/17 | 345.15 | 2015/3/4 | 358.24 | ||||||||||||
| 2015/2/18 | 348.47 | 2015/3/5 | 357.02 | From 2013/8 to Present | |||||||||||
| 2015/2/19 | 350.03 | 2015/3/6 | 359.78 |
|
|||||||||||
| 2015/2/20 | 351.17 | 2015/3/9 | 359.44 | ||||||||||||
| 2015/2/23 | 355.1 | 2015/3/10 | 355.67 | ||||||||||||
| 2015/2/24 | 354.42 | 2015/3/11 | 354.22 | ||||||||||||
| 2015/2/25 | 357.8 | 2015/3/12 | 358.09 | ||||||||||||
| 2015/2/26 | 363.26 | 2015/3/13 | 357.63 | ||||||||||||
| 2015/2/27 | 360.15 | 2015/3/16 | 356.54 | ||||||||||||
| 2015/3/2 | 360.29 | 2015/3/17 | 356.82 | ||||||||||||
| 2015/3/3 | 362.19 | 2015/3/18 | 354.76 | ||||||||||||
| 2015/3/4 | 358.24 | 2015/3/19 | 348.39 | ||||||||||||
| 2015/3/5 | 357.02 | 2015/3/20 | 348.26 | ||||||||||||
| 2015/3/6 | 359.78 | ||||||||||||||
| 2015/3/9 | 359.44 | ||||||||||||||
| 2015/3/10 | 355.67 | ||||||||||||||
| 2015/3/11 | 354.22 | ||||||||||||||
| 2015/3/12 | 358.09 | ||||||||||||||
| 2015/3/13 | 357.63 | ||||||||||||||
| 2015/3/16 | 356.54 | ||||||||||||||
| 2015/3/17 | 356.82 | ||||||||||||||
| 2015/3/18 | 354.76 | ||||||||||||||
| 2015/3/19 | 348.39 | ||||||||||||||
| 2015/3/20 | 348.26 | ||||||||||||||
| ЃEЃEЃE | Ѓ@ | ||||||||||||||